E-ISSN:2456-6454
P-ISSN:2581-4907
RNI:MPENG/2017/74152

Research Article

Smartphone

Tropical Journal of Ophthalmology and Otolaryngology

2020 Volume 5 Number 7 September-October
Publisherwww.medresearch.in

A study of the correlation between smartphone usage and dry eye in medical students at a tertiary care center

Faruqui S.1, Agarwal R.2, Kumar R.3*
DOI: https://doi.org/10.17511/jooo.2020.i07.02

1 Saba Faruqui, Assistant Professor, Department of ophthalmology, LN Medical College and JK Hospital, Bhopal, Madhya Pradesh, India.

2 Rahul Agarwal, Professor and Head, Department of ophthalmology, LN Medical College and JK Hospital, Bhopal, Madhya Pradesh, India.

3* Rashmi Kumar, Associate Professor, Department of ophthalmology, LN Medical College and JK Hospital, Bhopal, Madhya Pradesh, India.

Background: CVS and dry eye disease due to computers, in general, is well documented, but specific literature on smartphone usage leading to these conditions is limited. This study aims to estimate the prevalence of dry eye and determine the effect of duration of use on the CVS symptoms in college-going smartphone users. Aims: (1) To find a correlation between smartphone usage and dry eye(2)To find the prevalence of dry eye disease in the smartphone using college students (3)To study whether the duration and pattern of smartphone usage has a bearing on the severity of CVS symptoms. Materials and Methods: 394 medical students using smartphones for over a year and without pre-existing dry eye disease or ocular surface pathology were included. Tear film parameters were estimated. The duration of use and smartphone settings were correlated with the prevalence of dry eye and computer vision syndrome symptoms. Results: The prevalence of dry eye was 20.81%. The average DED score was 1.56±0.234, and 1.35±0.248 respectively in the DED and non-DED group with a p-value of 0.0001. The most common CVS symptoms were fatigue (54% in DED,44% in non-DED) and heaviness in both groups (60.9% in DED, 45% in non-DED group.). Conclusions: There was a statistically significant increase in the DED symptom score and the prevalence of CVS symptoms with increasing duration of use and daily exposure to smartphones.

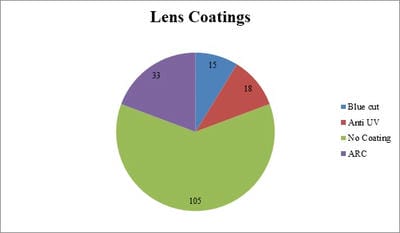
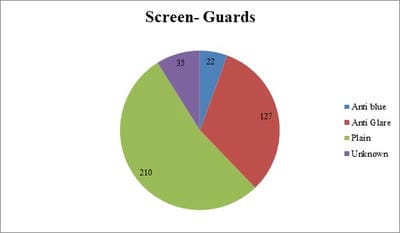
Keywords: Smartphone, Dry eye disease, Computer vision syndrome, Blue filters, Screen guard

Corresponding Author How to Cite this Article To Browse
Rashmi Kumar, Associate Professor, Department of ophthalmology, LN Medical College and JK Hospital, Bhopal, Madhya Pradesh, India.
Email:
Faruqui S, Agarwal R, Kumar R. A study of the correlation between smartphone usage and dry eye in medical students at a tertiary care center. Trop J Ophthalmol Otolaryngol. 2020;5(7):174-182.
Available From
https://opthalmology.medresearch.in/index.php/jooo/article/view/165

Manuscript Received Review Round 1 Review Round 2 Review Round 3 Accepted
2020-09-28 2020-10-08 2020-10-16 2020-10-19
Conflict of Interest Funding Ethical Approval Plagiarism X-checker Note
No Nil Yes 8%

© 2020 by Saba Faruqui, Rahul Agarwal, Rashmi Kumar and Published by Siddharth Health Research and Social Welfare Society. This is an Open Access article licensed under a Creative Commons Attribution 4.0 International License https://creativecommons.org/licenses/by/4.0/ unported [CC BY 4.0].

Introduction

Ours is a technologically driven generation and digital devices including smartphones are an essential part of our lives. Smartphones are mini-computers that bring the world at our finger-tips. Besides communication and entertainment, the smartphone has evolved into an important educational tool that provides instant access to reference materials and databases on the go. In the medical field also smartphones serve a vital role in diagnosis, discussion, record keeping, and health education [1-5].

The downside of this digital revolution is that the increased screen-time has a negative impact on ocular health. The small size and distance at which the handheld smartphone screen is used, require increased accommodative effort by the eye muscles which leads to asthenopic symptoms such as blurring, fatigue, dryness, and grittiness which are referred to as Computer vision syndrome (CVS) [6]. Added to that is the reduced blink-rate, which causes Dry Eye Disease (DED) by altering the tear film dynamics [7,8]. Long-standing dry eye disease leads to corneal epithelial changes which further aggravate the symptoms. Recently there is evidence to suggest that blue light emitted by the phone screens has a damaging effect on retinal and corneal epithelium [9]. The use of blue light blocking glasses and screen guards has been shown to reduce the symptoms of eye strain and fatigue [10].

There are many national and international studies on Computer Vision Syndrome and Dry Eye Disease associated with computer use, but the number of studies on the effect of smartphone use on symptoms of eye strain and tear film parameters is limited. Thus, the purpose of this study was to look for any correlation between smartphone usage and dry eye, as well as report the frequency of computer vision syndrome (asthenopic) symptoms in smartphone users.

The current study selected medical students for our work because at present there was no data on thesmartphone-related ocular problems faced by this vulnerable group which has to rely on their phones for educational purposes besides the other routine uses. To the best of our knowledge, no studies are showing a correlation of dry eye symptoms with screen brightness and the use of blue-blocking mobile-screen guards. Thus, these points were also explored.

Materials and methods

Study setting: Department of Ophthalmology, LN Medical College and JK hospital, Bhopal

Study Duration: Jan 2019-Jan 2020

Ethical considerations and permission: The study followed the tenets of the declaration of Helsinki, was approved by the Ethics and Review committee, LN Medical College, and JK Hospital, and complied with the Health Insurance Portability and Accountability Act.

Study Type: Observational cross-sectional study

Sampling method: Convenient Sampling

Sample size: 394, calculated in consultation with a medical statistician, Dept of Community Medicine, LN Medical college

Inclusion Criteria:

  1. College going students between the age of 19-25 years
  2. Those giving consent for the study were included
  3. Using a smartphone for more than 1 year

Exclusion Criteria

  1. Those having a pre-existing dry eye disease
  2. Those with ocular surface pathologies such as meibomian gland disease, pinguecula, or pterygium
  3. Those having a history of ocular trauma or refractive surgery
  4. Those using any eye drops or ointments

Data Collection procedure: All the participants have explained the nature and purpose of the study and made to sign a Free and Informed Consent Form, before starting data collection.

Questionnaire: The participants were made to fill a questionnaire containing basic demographic information, the period and daily duration of smartphone usage, and the symptoms of the dry eye experienced by them. The duration of smartphone usage was divided into 2 groups: 0-3 years and more than 3 years [11,12]. Similarly, the number of hours spent daily on the smartphone were categorized into: less than or equal to 3 hours and more than 3 hours based on previous studies. The evaluation of symptoms was done by a modified OSDI (Ocular Surface Disease Index) [11].


The questions of dry eye symptoms had 4 possible responses “never”, “sometimes”, “often” and “always”. Subjects who responded to more than 2 of the questions by “always” or “often” were considered positive for symptoms of DED. The mean of all the points was the dry eye disease score. (DED score) [13].

Clinical Evaluation: It consisted of a comprehensive eye examination on slit-lamp, and evaluation of tear film parameters such as Schirmer’s test, Tear film break-up time, tear meniscus height, and corneal surface staining. All the clinical measurements were carried out in a single, non-air-conditioned room with constant temperature and humidity.

Tear film quantity was tested by Schirmer’s test. (Non-invasive superficial procedure) It was performed with the help of a 5x35mm strip of the Whatman-41 filter paper. The strip was folded 5mm from one end and kept in the lower fornix of both eyes at the junction of lateral one-third and medial two-thirds. After 5 minutes, the strips were removed and the length of filter paper wetted was noted in mm. Tear film stability was assessed by the Tear film breakup time (TBUT). The patient was seated on a slit lamp and the eye was stained with fluorescein dye strip. The patient was asked to blink 2-3 times and then instructed to look straight ahead without blinking. The interval between the last blink and the appearance of the first corneal dark spot was measured in seconds. The tear meniscus height (TMH) was measured at the slit lamp (Haag Streit model) with a narrow vertical beam of light of 0.3 and 1.0mm from the lower lid margin to the top of the tear meniscus. Keratoepitheliopathy was measured by multiplying the area score by density score after staining with 0.5% fluorescein dye. The staining area was graded on a numerical scale of 0–3, with 0 representing no punctate staining; 1, less than one-third; 2, one-third to two-thirds; and 3, more than two-thirds. The staining density was graded on a numerical scale of 0–3, with 0 representing no punctate staining; 1, sparse density; 2, moderate density; and 3, high density with overlapping lesions.

Diagnosis and scoring of dry eye disease: The presence of DED was diagnosed based on the criteria defined by the Dry Eye Society in 2006 [14]. These criteria include the presence of (1) dry eye symptoms, (2) qualitative or quantitative abnormalities of the tear film in one or both eyes (Schirmer's test results of ≤5 mm or TBUT of ≤5

seconds); and (3) conjunctivocorneal epithelial damage (total staining score of ≥ 3 out of 9 points). Participants meeting all the criteria were considered to have definite DED, and those meeting 2 criteria in one or both eyes had probable DED; the presence of 1 or absence of any criterion indicated no DED. Participants with definite and probable DED were classified into the DED group.

History of the presence and type of refractive error was elicited. Those wearing spectacles were asked about the type of spectacle coating. The brightness setting used by the participants and the type of screen guard used on the mobile phone was determined.

Data Analysis: The data were analyzed with the SPSS software (version 21, SPSS Inc., Chicago, I.L.) Continuous variables were compared using Student’s t-test, and non-continuous variables were compared by the chi-square test. p values of < 0.05 were considered significant.

Results

This study included 394 medical students, 160 males (40.75%) and 234 females 59.24%, aged between 17-25 years, the mean age was 20.75years. Based on the previously defined criteria (see Materials and methods) for dry eye disease (DED) 25 participants were found to have definite DED (0.063%) and 57 (0.14%) had probable DED, thus a total of 82 (20.81%) were in the DED group and the remaining 312 (79.18%) were in the non-DED group.

The prevalence of DED was found to be 20.81%. There was no statistical difference in the prevalence of DED in males and females. The comparison of both groups in terms of their demographic profile and tear film parameters is shown in Table 1.

Table-1: Demographics and Tear Film parameters of DED and non-DED group.

  DED group Non-DED group p-value
Sex n (%) Males 24 (15%) 136 (85%) 0.022**
Females 58 (24.78%) 176 (75.21%)
Schirmer’s Test (mm) Mean±SD 15.76±9.00 19.95±7.81 <0.0002†
TBUT (sec) Mean±SD 5.621±2.88 8.544±2.79 <0.0001†
TMH (mm) Mean±SD 0.178±0.075 0.313±0.11 <0.0001†
Mean DED score± SD 1.56±0.234 1.35±0.248 0.0001†

Fisher exact test, Independent t-test, ‡ TBUT (tear film break-up time), TMH (tear meniscus height), DED (dry eye disease)


The mean Schirmer’s score was 19.08mm±8.24. 95.6% (376) participants had a Schirmer’s score of more than 5mm. The mean TBUT was 7.93 ± 3.05 and 71.06% (279) had a TBUT>5mm. In 62.18% (244) subjects the tear meniscus height was >0.3mm, the average TMH was 0.28±0.12mm.

The mean values of all the three tear film parameters were lower in the DED group compared to the non-DED group and the difference was statistically significant as inferred by the student’s t-test.

Table 2 shows the relative frequency of symptoms of computer vision syndrome (CVS) among the DED and non-DED groups. Fatigue was the most common symptom in the DED group (64.4%)while heaviness was the most commonly reported symptom in the non-DED group (44.5%).

The frequency of fatigue (64.4% vs. 44.55% , p 0.0012) watering (56.09% vs.37.82%,p 0.0036), blurring (57.3% vs. 36.21%, p 0.0006), dryness (30.48% vs. 15.7%, p=0.0039) and photophobia (57.31% vs. 39.74% p =0.0056) were significantly higher in the DED group as compared to the non DED. However, the reported frequency of redness, grittiness, and heaviness was not significantly different in the two groups. The average DED score was higher in the DED group(1.56±0.234) than in the non-DED group it was (1.35±0.248), with a p-value of 0.0001.

Table-2: Comparison of Frequency of Symptoms of CVS in the DED and non-DED group.

Symptoms N(%) DED group N=82(%) Non DED group N=312(%) p value*
Fatigue 53 (64.4) 139 (44.55) 0.0012
Blurring 47 (57.3) 113 (36.21) 0.0006
Watering 46 (56.09) 118 (37.82) 0.0036
Redness 29 (35.36) 84 (26.92) 0.134
Dryness 25 (30.48) 49 (15.70) 0.0039
Grittiness 14 (17.07) 62 (19.87) 0.639
Heaviness 50 (60.93) 141 (45.12) 0.129
Photophobia 47 (57.31) 124 (39.74) 0.0056

Fisher’s exact test, CVS (computer vision syndrome)

The mean daily usage of smartphones in hours per day was 3.58±1.186. The mean duration of usage in years was 3.195±0.78, ranging from 1-6 years. Table 3 shows the comparison between the DED and non-DED groups in terms of daily usage in hours and duration of usage in years.

The mean duration of usage in years (3.39±0.64 in DED vs. 3.144±0.806 in non-DED, p=0.01) was higher in the DED group, while the difference in the mean daily duration of use in hours was not statistically significant.

Table-3: Comparison of Average Duration in Years and Daily Usage in Hours in DED and non-DED groups.

  DED group Non-DED group p*
n 82 n 312
Duration of use in years Mean±SD 3.39±0.64 3.144±0.806 0.0109
Daily Usage (hours/day) Mean±SD 3.73±1.197 3.551±1.182 0.2243

unpaired t-test

Table 4 shows increasing prevalence rates and odds ratios (OR) of CVS symptoms with increasing daily exposure to a smartphone in hours (by logistic regression analysis). A p-value of <0.05 was considered significant. It was seen that students who used smartphones for more than three hours per day had a higher risk of symptoms of heaviness (OR 2.042, p=0.0005), blurring (OR 1.96, p= 0.0013), fatigue (OR 1.55,p= 0.03), dryness (OR 1.708, p=0.039), and photophobia(OR 1.72, p=0.01) than those who used it for less than 3 hours per day. The odds ratios for the other symptoms of CVS were not statistically significant.

Table-4: Effect of Daily Duration of smartphone usage on the frequency of symptoms.

Symptoms More than 3 hours/day n= 173 Less than 3 hours/day n= 221 Odds ratio* p value† CI‡
Fatigue 95 97 1.55 0.030 1.043-2.324
Blurring 86 74 1.96 0.0013 1.305-2.955
Watering 80 84 1.403 0.1223 0.936-2.101
Redness 56 57 1.377 0.178 0.88-2.135
Dryness 41 34 1.708 0.0394 1.030-2.835
Grittiness 36 41 1.154 0.609 0.699-1.902
Heaviness 101 90 2.042 0.0005 1.363-3.059
Photophobia 88 83 1.72 0.0104 1.149-2.578

⃰Odds ratios calculated by univariate logistic regression analysis, 95% confidence intervals, p<0.05 considered significant

Similarly, the association between duration of use in years and CVS symptoms was studied (Table 5). It was found that only heaviness (OR 1.66 p=0.015) was significantly associated with usage of more than 3 years while blurring, watering, and grittiness (OR 1.30,1.24, 1.247 respectively) had higher odds but were not statistically significant.

Table-5: Effect of Duration of usage in years on CVS symptoms.

Symptoms More than 3 years N= 216 Less than 3 years N=178 Odds Ratio* p value† CI‡
Fatigue 102 90 0.87 0.544 0.588-1.301
Blurring 94 66 1.30 0.216 0.871-1.963
Watering 95 69 1.24 0.306 0.828-1.858
Redness 58 56 0.806 0.372 0.521-1.247
Dryness 33 41 0.602 0.052 0.362-1.003
Grittiness 45 31 1.247 0.442 0.750-2.07
Heaviness 117 74 1.66 0.015 1.113-2.48
Photophobia 92 79 0.929 0.759 0.623-1.387

⃰Odds ratios calculated by univariate linear regression analysis, p-value of < 0.05 considered significant, Confidence intervals 95%

Refractive errors were present in 247 (62.69%) students, out of which 176 (71.25%) were using spectacles. 71 wore spectacles with a special coating, while 105 wore plain spectacles without any coating and 5 were not aware of any coating. The effect of different types of spectacle coating on the mean DED score is shown in table 6. One way Anova showed a significant difference in the mean DED scores among different groups, especially a comparison between group 2 (blue cut coating) and group 4 (no coating) showed a significantly lower mean DED score in group 2 with p< 0.05 and a q value of 4.083.

Table-6: Effect of the type of special coating on spectacles on the average DED score.

Coating type Number Average DED symptom score p*
ARC 33 1.409±0.288 0.0317
Blue cut 15 1.216±0.223  
UV 18 1.458±0.246  
No Coating 105 1.422±0.260  

One way ANOVA with post-test. The comparison between groups 2 and 4 revealed p<0.05, with a q value of 4.083.ARC(anti-reflection coating), UV (ultraviolet)

The effect of smartphone screen brightness on the DED score is shown in Table 7. The mean DED score in group 1 (<50% screen brightness) was lower than the other 2 groups, and the difference between group 1 and group 3 (automatic brightness setting) was extremely significant statistically with a p<0.001.

Table-7: Effect of screen brightness on the average DED symptom score.

Screen Brightness level Number of participants Average DED symptom score Mean±SD p*
<50% 237 1.357±0.255 <0.0001
>50% 43 1.404±0.269  
Automatic 109 1.485±0.248  
Not aware 5    

One way Anova with post-test, comparison between group 1 and 3 is extremely significant with p<0.001

Table 8 shows the effect of protective screen guard against blue light (anti-blue light screen guard), the 22 smartphone users that had anti-blue light screen guard had significantly lower mean DED scores than those who used plain screen guard or anti UV screen guard ( p< 0.0198, by one way Anova).

Table-8: Effect of the type of Screen Guard on the Average DED symptom score.

Type of screen protector Number of users DED symptom score (Mean±SD) p*
Anti-blue 22 1.289±0.222 0.0198
Anti-glare 127 1.370±0.253  
Plain 210 1.427±0.268  
Not aware 35 1.416±0.263  

*One-way Anova, comparison between group1 and 3 is significant p<0.05

Discussion

The current study aimed to estimate the prevalence of dry eye and its correlation with the duration of smartphone exposure in hours and years and thus fill the gap in our knowledge about this aspect of smartphone use and ocular health.


It was found the prevalence of dry eye disease in smartphones using college students to be 20.8%. DED (dry eye disease) was defined based on asthenopia symptoms and tear film parameters (Schirmer's test, Tear film break up time, Tear meniscus height, and corneal staining). Various previous studies carried out with different populations have used different diagnostic criteria and thus come up with different prevalence rates. Ayman et al reported a prevalence of 49.4% which was based on only subjective symptoms assessed by questionnaire [15]. A similar study conducted by Bukhari et al in the same region had reported a much higher prevalence of 93.2%, which was based on clinical parameters plus reported symptoms, but the study population was different, consisting of all age groups, including the elderly [16]. A Korean Study by Jun Moon et al on the smartphone-using pediatric population found a rate of 6.6% [17]. As pointed out earlier, our literature search revealed numerous studies on digital display terminals and computer use on DED but specific literature on smartphone-related DED and CVS is sparse. There are especially no Indian studies to compare with.

The ocular symptoms of CVS (computer vision syndrome) are grouped as asthenopia. Studies have reported that 60-90% of people working on computers develop asthenopia [18]. The same observation was made by us in this study, it was that found greater DED scores and lower values of tear film parameters in the DED group, as compared to the non-DED group. Tear film abnormalities concerning DED have been reported by various studies [19-22]. There are several factors at work that lead to more severe asthenopic symptoms from using the smartphone than the computer screen [6-8]. The smaller screen size coupled with the shorter viewing distance of about 35cm for smartphones, as compared to the normal reading distance of 40cm, requires greater accommodative effort by the ciliary muscles and thus gives rise to eye strain [23]. Another factor is the reduced blink rate reported with the use of any digital visual device such as smartphones, tablets, computer screens, and electronic book readers. This leads to greater evaporation of the tear film and symptoms of dryness and grittiness [24]. The third factor which has been recently studied and found to be of increasing importance in the etiology of smartphone-related dry eye and asthenopia is the blue light emitted by the LED (light-emitting diode) display. This light has a peak emission wavelength of 400-490nm, which is in the blue range [25].

This light is known to cause several adverse effects on the cornea and retina by increasing oxidative and phototoxic damage [9,26,27]. This could explain the increase in ocular symptoms such as blurring, redness, visual disturbance, and watering on exposure to a smartphone. Additionally, blue light has a damaging effect on the retina and disrupts the melatonin cycle, thus interfering with sleep [28]. The severity of symptoms of CVS also depends on the duration of exposure [29,30]. It was found that higher prevalence and odds ratios of fatigue, heaviness, blurring, photophobia, and dryness in students who used smartphones for more than 3 hours a day. The time spent daily on the smartphone by young people especially has been increasing to dangerously high levels [8,31]. The impact of blue-blocking lenses in spectacles on visual fatigue experienced by digital device users have been explored by several authors [32,33]. It is reported that blue-blocking lenses reduce CVS symptoms after computer tasks [34]. Similar findings were noted in the current study. However, the awareness of blue light-induced ocular damage and the availability of lens coatings and screen filters was found to be low among the present study population as shown in Figures 1 and 2. Similar findings were reported by Sanodia et al [35].

opthal_165_01.jpg

Fig-1: Types of protective coatings used by the participants wearing glasses.

opthal_165_02.jpg

Fig-2: Types of screen protectors used on the smartphone screen.


Presently there are not many studies exploring the effect of phone screen brightness on the asthenopic symptoms and tear film parameters. However, experts believe that the ideal screen brightness depends on the ambient light. As a simple rule, the brightness of our gadget should be equivalent to the light surrounding us, such that both the lights' radiance is similar. By doing so, they will blend in, causing the least damage to our eyes.

The current study evaluated the effect of different screen-brightness levels on the DED scores and concluded that <50% setting was the most comfortable, with the lowest DED scores. Many kinds of screen guards or protectors are available, meant to be applied over the smart-phone screen for physical protection from scratches and cracks as well as to curb the reflective nature of the screen to limit the glare on eyes. There is no clinical data on the efficacy of any particular type of screen guard in ameliorating symptoms of eye strain. The present study found significantly lower DED scores in the few users who chose anti-blue screen filters.

limitations

due to the Questionnaire format of data collection, the information gathered could suffer from recall and information bias. Also because the current study population is comprised of medical students from a single institute, there could be selection bias, as the prevalence of CVS and DED may vary with the curriculum and environmental and regional factors.

What does the study add to the existing knowledge

The current study included large sample size and after removing the confounding factors, the current study tried to estimate not only the prevalence of DED but also its association with the duration of exposure. This study has sought answers to thus far unexplored questions about the usefulness of blue light filtering screens and the optimal screen brightness on ocular health.

Conclusion

This study shows that smartphone use increases the symptoms of CVS and DED, even more than computer work and that the duration of exposure plays an important role in the severity of these symptoms.

There is a need to increase awareness about the ergonomic factors such as taking frequent breaks, choosing optimal screen brightness, and use of blue light cutting screens and apps to promote better ocular health.

Author contributions

Dr. Rahul Agarwal: Conceived and designed the study and supervised the project.

Dr. Saba Faruqui: Literature search, data collection, statistical calculations and wrote the manuscript.

Dr. Rashmi Kumar: Data collection and supervised the project.

Reference

  1. Choi JS, Yi B, Park JH, Choi K, Jung J, Park SW, Rhee P. The uses of the smartphone for doctors- An empirical study from Samsung medical center. Healthc Inform Res. 2011;17(2)131–138.
  2. Lindquist A, Johansson P, Petersson G, Saveman B, Nilsson G. The use of the personal digital assistant (PDA) among personnel and students in health care- A review. J Med Internet Res. 2008;10(4)e31.
  3. McLeod RP, Mays MZ. Back to the future- Personal digital assistants in nursing education. Nurs Clin North Am. 2008;43(4)583–592,vii.
  4. Robinson T, Cronin T, Ibrahim H, Jinks M, Molitor T, Newman J, Shapiro J. Smartphone use and acceptability among clinical medical students- A questionnaire-based study. J Med Syst. 2013;37(3)9936.
  5. Payne Karl Frederick Braekkan, Wharrad H, Watts K. Smartphone and medical related App use among medical students and junior doctors in the United Kingdom (UK)- A regional survey. BMC Med Inform Decis Mak. 2012;12(1)121.

  1. Choi JH, Li Y, Kim SH, Jin R, Kim YH, Choi W, et al. The influences of smartphone use on the status of the tear film and ocular surface. PLoS One. 2018;13(10)e0206541.
  2. Moon JH, Kim KW, Moon NJ. Smartphone use is a risk factor for pediatric dry eye disease according to region and age- a case control study. BMC Ophthalmol. 2016;16(1)188.
  3. Kim J, Hwang Y, Kang S, Kim M, Kim TS, Kim J, et al. Association between exposure to smartphones and ocular health in adolescents. Ophthalmic Epidemiol. 2016;23(4)269–276.
  4. Lee JB, Kim SH, Lee SC, Tsuyama A, Ogawa J, Matsumoto Y, et al. Blue light-induced oxidative stress in human corneal epithelial cells- protective effects of ethanol extracts of various medicinal plant mixtures. Invest Ophthalmol Vis Sci. 2014;55(7)4119-4127.
  5. Lee HS, Cui L, Li Y, Choi JS, Choi JH, Li Z, et al. Influence of light emitting diode-derived blue light overexposure on mouse ocular surface. PLoS One. 2016;11(8)e0161041.
  6. Toda I, Fujishima H, Tsubota K. Ocular fatigue is the major symptom of dry eye. Acta Ophthalmol (Copenh). 1993;71(3)347–352.
  7. Uchino Y, Uchino M, Dogru M, Ward S, Yokoi N, Tsubota K. Changes in dry eye diagnostic status following implementation of revised Japanese dry eye diagnostic criteria. Jpn J Ophthalmol. 2012;56(1)8-13.
  8. Kawashima M, Yamatsuji M, Yokoi N, Fukui M, Ichihashi Y, Kato H, et al. Screening of dry eye disease in visual display terminal workers during occupational health examinations- The Moriguchi study. J Occup Health. 2015;57(3)253-258.
  1. DEWS report. The epidemiology of dry eye disease- report of the epidemiology subcommittee of the international dry eye workshop. Ocul Surf. 2007;5(2)93-107.
  2. Baabdullah AM, Abumohssin AG, Alqahtani YA, Nemri IA, Sabbahi DA, Alhibshi NM. The association between smartphone addiction and dry eye disease- A cross-sectional study. J Nat Sci Med. 2019;2(2)81-85.
  3. Bukhari A, Ajlan R, Alsaggaf H. Prevalence of dry eye in the normal population in Jeddah, Saudi Arabia. Orbit. 2009;28(6)392-397.
  4. Moon JH, Kim KW, Moon NJ. Smartphone use is a risk factor for pediatric dry eye disease according to region and age- a case control study. BMC Ophthalmol. 2016;16(1)188.
  5. Uchino M, Yokoi N, Uchino Y, et al. Prevalence of dry eye disease and its risk factors in visual display terminal users- the Osaka study. Am J Ophthalmol. 2013;156(4)759-766.
  6. Koh S, Maeda N, Hirohara Y, Mihashi T, Bessho K, Hori Y, et al. Serial measure¬ments of higher-order aberrations after blinking in patients with dry eye. Invest Ophthalmol Vis Sci. 2008;49(1)133-138.
  7. Goto E, Yagi Y, Matsumoto Y, Tsubota K. Impaired functional visual acuity of dry eye patients. Am J Ophthalmol. 2002;133(2)181-186.
  8. Kaido M, Matsumoto Y, Shigeno Y, Ishida R, Dogru M, Tsubota K. Corneal fluorescein staining corre-lates with visual function in dry eye patients. Invest Ophthalmol Vis Sci. 2011;52(13)9516-9522.

  1. Uchino M, Uchino Y, Dogru M, Kawashima M, Yokoi N, Komuro A, et al. Dry eye disease and work productivity loss in visual display users- the Osaka study. Am J Ophthalmol. 2014;157(2)294-300.
  2. Bababekova Y, Rosenfield M, Hue JE, Huang RR. Font size and viewing distance of handheld smart phones. Optom Vis Sci. 2011;88(7)795-797.
  3. Portello JK, Rosenfield M, Chu CA. Blink rate, incomplete blinks and computer vision syndrome. Optom Vis Sci. 2013;90(5)482-487.
  4. Tosini G, Ferguson I, Tsubota K. Effects of blue light on the circadian system and eye physiology. Mol Vis. 2016;22;61-72.
  5. Li Z, Choi W, Oh HJ, Yoon KC. Effectiveness of topical infliximab in a mouse model of experimental dry eye. Cornea. 2012;31(1)S25-31.
  6. Balci M, Devrim E, Durak I. Effects of mobile phones on oxidant/antioxidant balance in cornea and lens of rats. Curr Eye Res. 2007;32(1)21-25.
  7. Jaadane I, Boulenguez P, Chahory S, Carré S, Savoldelli M, Jonet L, et al. Retinal damage induced by commercial light emitting diodes (LEDs) Free. Radic Biol Med. 2015;84;373–384.
  1. Rossignol AM, Morse EP, Summers VM, Pagnotto LD. Video display terminal use and reported health symptoms among Massachusetts clerical workers. J Occup Med. 1987;29(2)112-118.
  2. Logaraj M, Madhupriya V, Hegde S. Computer vision syndrome and associated factors among medical and engineering students in Chennai. Ann Med Health Sci Res. 2014;4(2)179-185.
  3. Haug S, Castro RP, Kwon M, Filler A, Kowatsch T, Schaub MP. Smartphone use and smartphone addiction among young people in Switzerland. J Behav Addict. 2015;4(4)299-307.
  4. Lin JB, Gerratt BW, Bassi CJ, Apte RS. Short-Wavelength light-blocking eyeglasses attenuate symptoms of eye fatigue. Investigative Opthalmol Visual Sci. 2017;58(1)442-447.
  5. Ide T, Toda I, Miki E, Tsubota K. Effect of blue light-reducing eye-glasses on critical flicker frequency. Asia Pac J Ophthalmol Phila. 2015;4(2)80-85.
  6. Cheng HM, Chen ST, Hsiang-Jui L, Cheng Y. Does blue light filter improve computer vision syndrome in patients with dry eye. Life Sci J. 2014;11(6)612-615.
  7. Sanodiya I, Kujur A, Sirohi S, Khatri AK. A cross sectional overview of digital eye strain- a growing health concern in this digital age in central India (Madhya Pradesh). Int J Community Med Public Health. 2019;6(11)4828-4833.